Search

How to Import and Export Excel Spreadsheets with C# and WPF

When working in a business setting, more specifically in the finance field, it is common to monitor stocks. When making big decisions for yourself, or your clients/end users, it is essential to know where the market was, where it is now, and where it will be heading. You’ll need the ability to import data concerning these stocks, effectively evaluate the data, and then make educated clear decisions. Not to mention, it is common practice to then export the data for your clients or end users, so they can visualize and understand all of the data easily.

In this article, we’ll demonstrate using Spread.NET to build an application with C# and Windows Presentation Foundation (WPF). The application is responsible for importing and retrieving three months’ worth of closing price history for various stock symbols via an Excel spreadsheet import process. The application will also be able to export an Excel spreadsheet containing the new data.

Application Goals

The goal of this application is to allow the user to provide a series of stock symbols via the import of an external Excel document. These symbols will then be processed by the application.

  • It will retrieve the three-month closing price history of each of the stocks via a REST API.
  • The historical data retrieved from the API will be displayed alongside the symbol in the spreadsheet component.
  • We’ll add a visualization of the stock price history using an inline Sparkline chart.
  • After processing, the user will also have the ability to export the resulting data into a new Excel document.

Let’s get started building the app.

Building a WPF Application

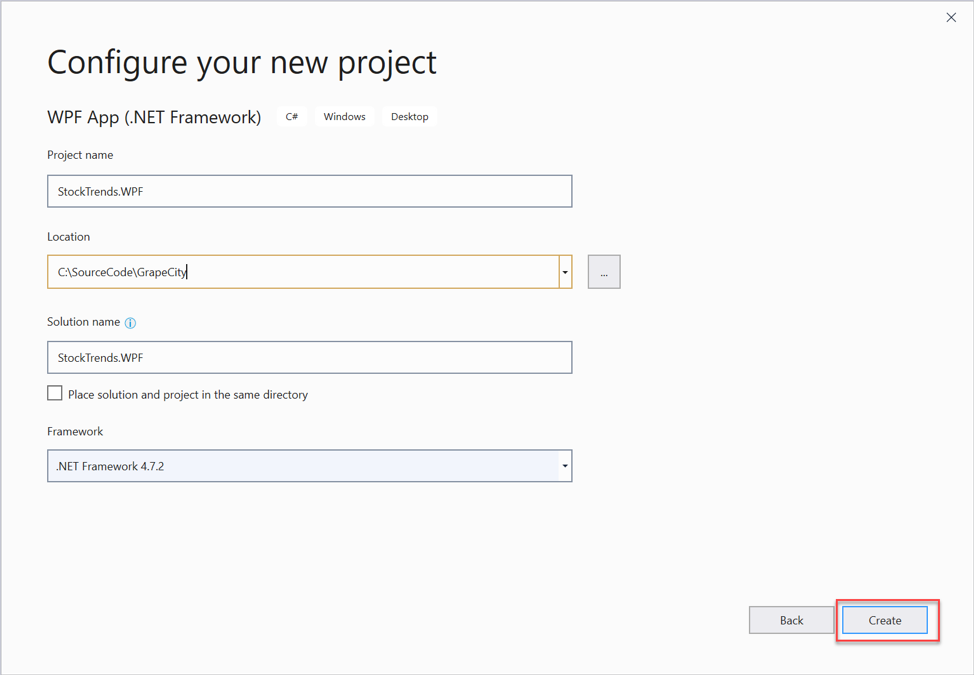
First, you’ll need to download and install the trial version of Spread.NET. After the installation process has completed, open Visual Studio 2019 and create a new WPF (.NET Framework) desktop application project. I named my project StockTrends.WPF.

Building a WPF Application

Once the solution has completed loading in Visual Studio, open MainPage.xaml in the editor, then open the Visual Studio Toolbox (CTRL + ALT + X). If you don’t see a Toolbox section named ComponentOne Spread, you will need to add the spreadsheet component to the toolbox manually – luckily, you’ll only ever have to do this once.

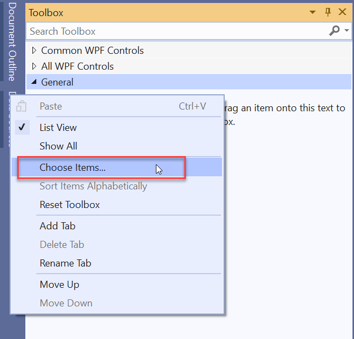
Add the component by right-clicking in the Toolbox panel, and from the menu select Choose Items.

Building a WPF Application

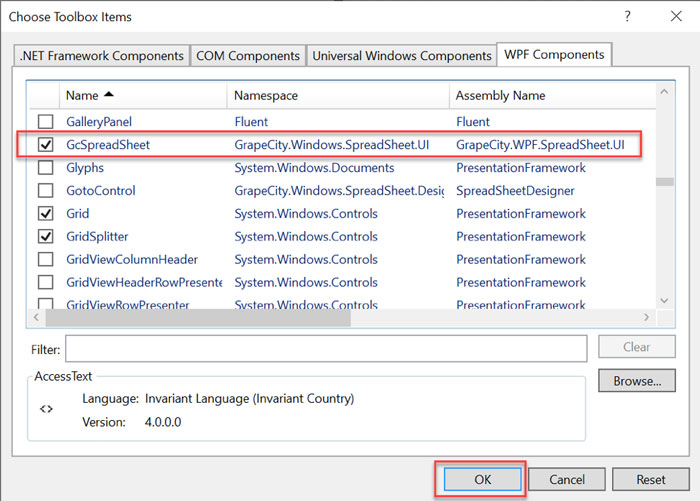
Next, in the Choose Toolbox Items dialog, ensure the WPF Components tab is selected and wait for it to populate (this can take several minutes). Scroll through the list, find and place a checkmark next to the GcSpreadSheet component located in the GrapeCity.WPF.SpreadSheet.UI namespace and press the OK button.

Building a WPF Application

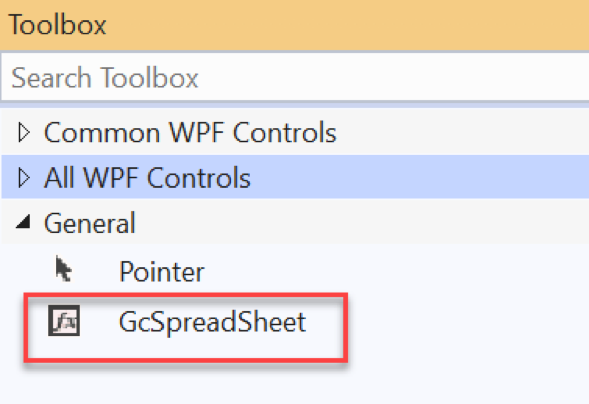
Now you will have the GcSpreadSheet control available to drag and drop from the toolbox onto your XAML documents.

Building a WPF Application

Defining the User Interface

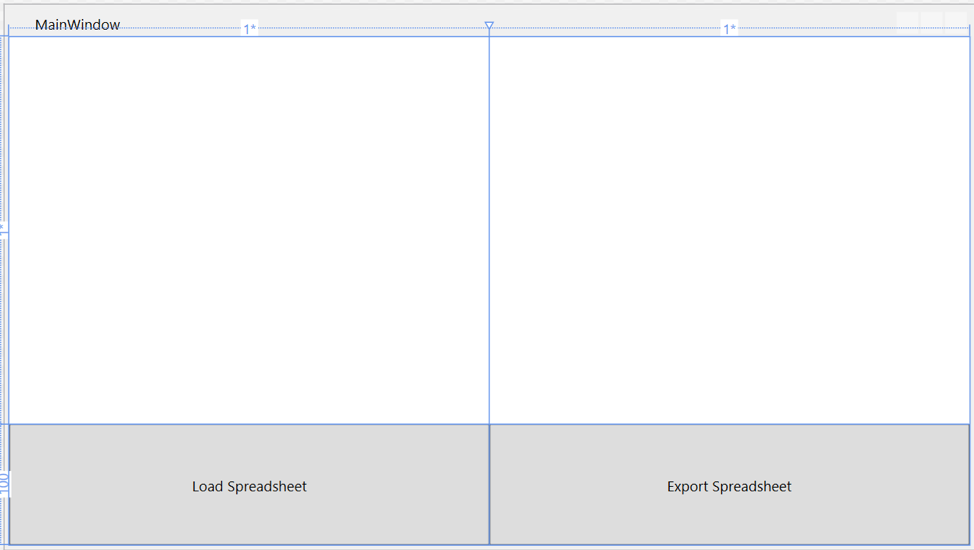
We will create a simple window that consists of two rows to satisfy the requirements of our WPF application. The first row consists of a large area that will house the Spread.NET spreadsheet component. Below it will be two buttons: one to import the symbols spreadsheet and one to export the results after processing.

With MainPage.xaml open in the Visual Studio editor, replace the existing Grid element with the following markup:

				
					    <Grid>  
        <Grid.RowDefinitions>  
            <RowDefinition />  
            <RowDefinition Height="100" />  
        </Grid.RowDefinitions>  
        <Grid.ColumnDefinitions>  
            <ColumnDefinition />  
            <ColumnDefinition />  
        </Grid.ColumnDefinitions>  
        <Button x_Name="btnLoadSpreadsheet" Grid.Row="1" Grid.Column="0"  
            Content="Load Spreadsheet" />  
        <Button x_Name="btnExportSpreadsheet" Grid.Row="1" Grid.Column="1"  
            Content="Export Spreadsheet" />  
   </Grid>


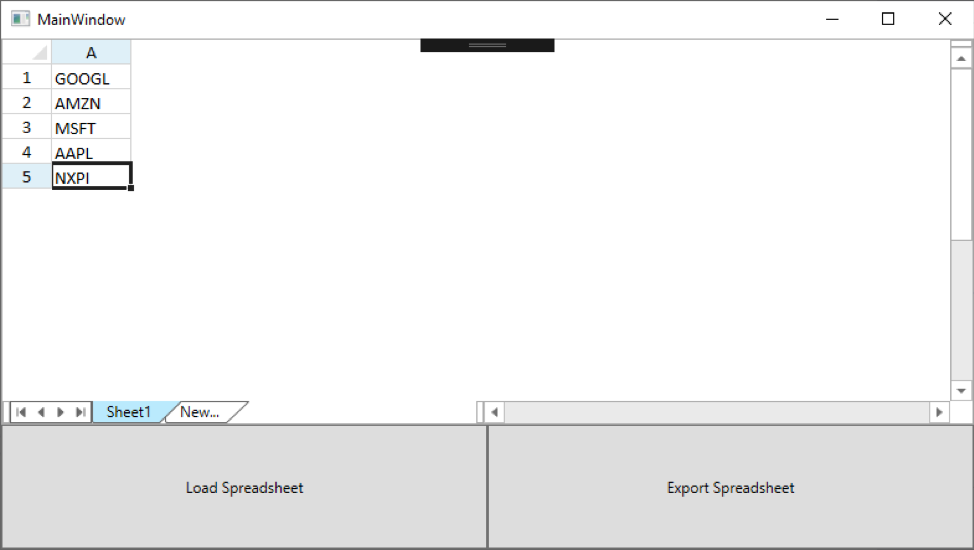
The designer of the window should now look similar to the following:

Building a WPF Application

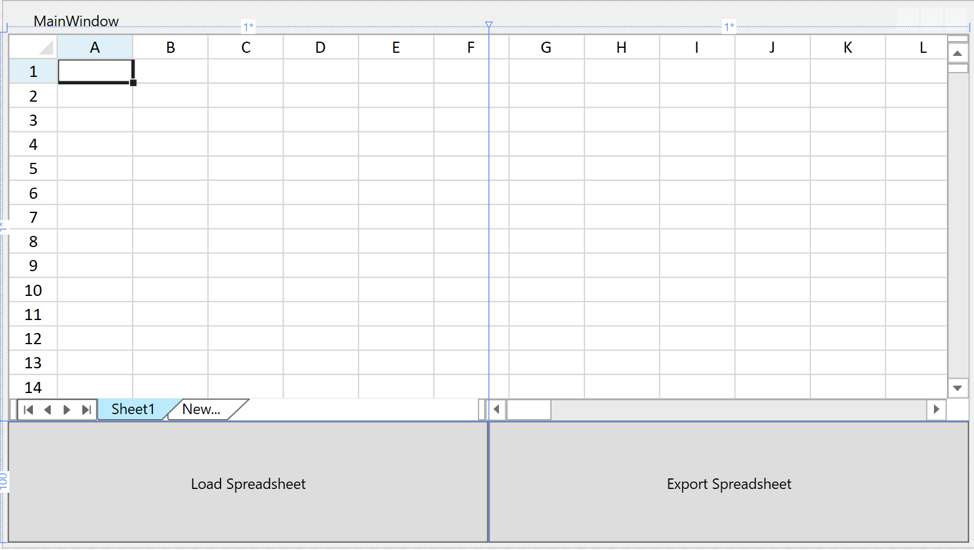
Next, drag the GcSpreadSheet component and drop it into the first cell of the grid.

Building a WPF Application

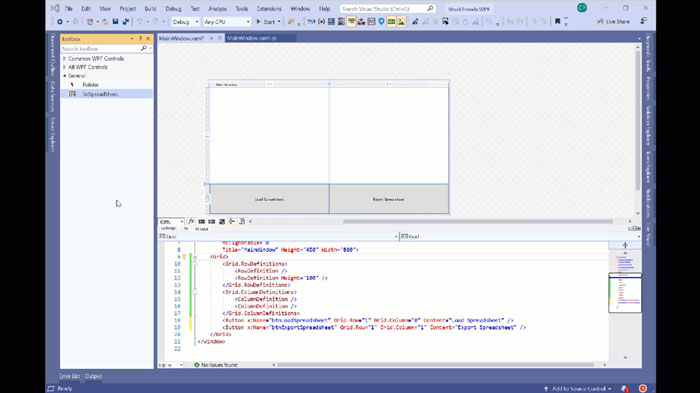
Edit the XAML element representing the spreadsheet component so that it matches the following:

				
					<ss:GcSpreadSheet x_Name="spreadControl" Grid.Row="0" Grid.Column="0" Grid.ColumnSpan="2"/>


The designer should now look similar to the following:

Importing an Excel File into the Spread.NET Component

Importing an Excel File into the Spreadsheet Component

The first piece of functionality that we will implement is importing an external Excel file into the Spread.NET spreadsheet component. This Excel spreadsheet contains a list of stock symbols the user would like to process in the application.

We will implement this functionality using the OpenFileDialog class from the Microsoft.Win32 namespace. This class allows you to add filters to the dialog so that the user can quickly select from existing Excel (*.xlsx) documents. Once a file is selected, the spreadsheet is then loaded into the spreadsheet component using a single line of code!

In the MainPage.xaml designer, double-click on the Load Spreadsheet button to implement the click handler. Implement the code as follows:

				
					private void BtnLoadSpreadsheet_Click(object sender, RoutedEventArgs e)  
       {  
            Microsoft.Win32.OpenFileDialog ofd = new Microsoft.Win32.OpenFileDialog();  
            ofd.DefaultExt = ".xlsx";  
            ofd.Filter = "Excel Documents (*.xlsx)|*.xlsx";  
            var sel = ofd.ShowDialog();  
            if (sel==true)    
            {  
                //one line of code to import the Excel file into Spread.NET  
                spreadControl.OpenExcel(ofd.FileName);  
            }  
        }


Next, we will create a simple spreadsheet in Excel that contains a list of stock symbols. This document consists of a single worksheet with one column. In this column, enter a stock symbol for processing. (For this example we’re not doing any data cleaning or error processing so that we can focus on the application code itself, so there are some rules about how the spreadsheet should be formatted: just one ticker symbol per row, and make sure you enter only valid ticker symbols.)

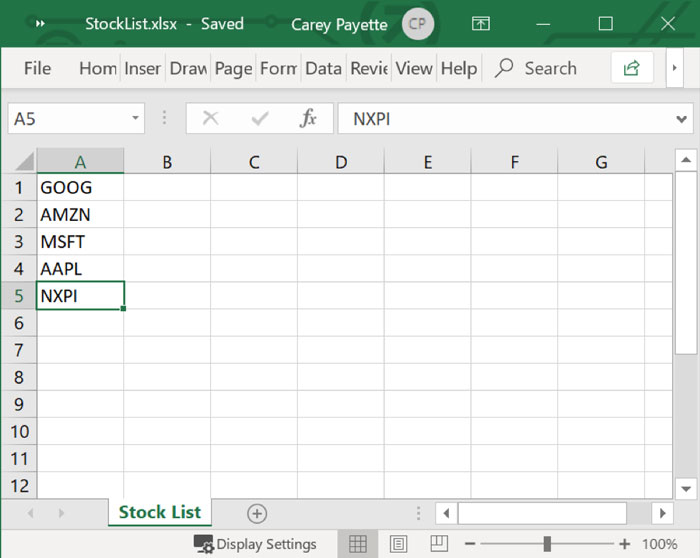
Run the application and select the Excel file that you just created. The file is then imported and displayed in the spreadsheet control of the application.

Exporting an Excel File from Spread.NET

Now that we have the import process functioning, we can move onto implementing the export functionality. We will be using the SaveFileDialog class located in the Microsoft.Win32 namespace because it can set extension filters in the dialog. The ability to export an Excel document from the Spread.NET component is also a simple process, accomplished with – (you got it) – a single line of code!

In the MainPage.xaml designer, double-click on the Export Spreadsheet button to implement the click event handler code. Implement the handler code as follows:

				
					        private void BtnExportSpreadsheet_Click(object sender, RoutedEventArgs e)  
        {  
            Microsoft.Win32.SaveFileDialog sfd = new Microsoft.Win32.SaveFileDialog();  
            sfd.FileName = "SpreadNET.xlsx";  
            sfd.Filter = "Excel Documents (*.xlsx)|*.xlsx";  
            sfd.DefaultExt = ".xlsx";  
            var sel = sfd.ShowDialog();  
            if (sel == true)  
            {  
                spreadControl.SaveExcel(sfd.FileName,  
                    GrapeCity.Windows.SpreadSheet.Data.ExcelFileFormat.XLSX);  
            }  
        }


Run the application once more, load the Stock Price spreadsheet once again, then press the Export Spreadsheet button to save a copy of the displayed spreadsheet onto your computer.

Retrieving Historical Stock Data

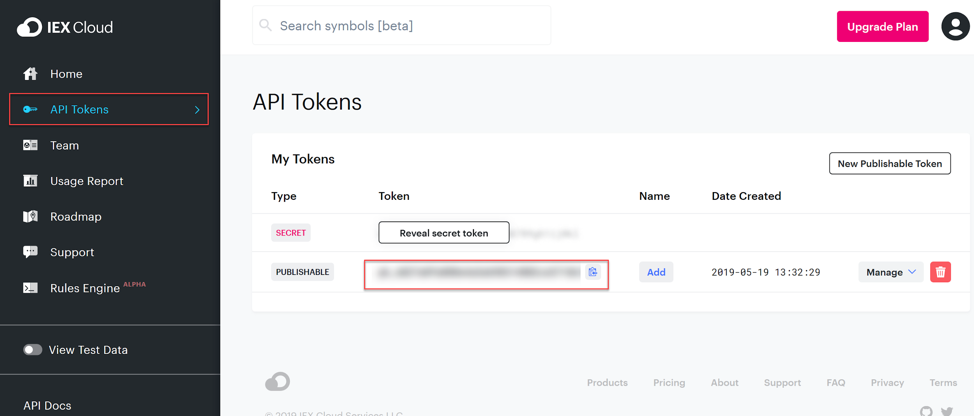
For this application, I’ve created a free account on the IEX Cloud to retrieve the three-month closing price history for the stocks in the spreadsheet. Once registered for an account, you will log into a dashboard console where you can obtain the API token to use with the IEX Cloud APIs.

We already know the full list of stock symbols when calling our API. It makes sense to use the batch request endpoint so that all data is obtained via a single call.

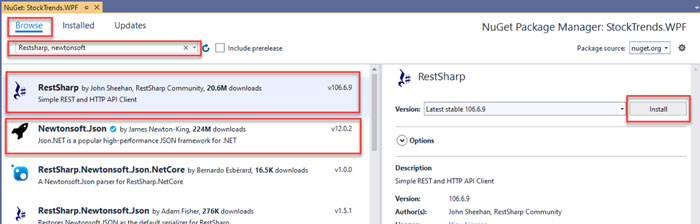
To implement the integration with the API, we will use two NuGet packages. Right-click on the project and select the Manage NuGet Packages option. Select the Browse tab, then search for and install the Newtonsoft.JSON and RestSharp packages.

Next, right-click on your project, and add a new class named StockHistoryRetriever. This file encapsulates all code relevant to the API integration. It also contains the definition of two additional classes that reflect the structure of the data from the IEX Cloud API.

In addition to the data encapsulation classes, this file also contains the method responsible for making the call out to the financial API. The code listing of StockHistoryRetriever is as follows (replace the API_TOKEN value with your own from the IEX Cloud dashboard).

				
					using Newtonsoft.Json.Linq;  
using RestSharp;  
using System;  
using System.Collections.Generic;

namespace StockTrends.WPF  
{  
    public class StockHistoryRetriever  
    {  
        private const string API_TOKEN = "<YOUR PUBLISHABLE API TOKEN>";  
        private const string BASE_URL = "https://cloud.iexapis.com";  
        private const string API_VERSION = "beta";

        public List<ClosingStockHistory> Get3MonthHistory(List<string> symbols)  
        {  
            var client = new RestClient(BASE_URL);  
            var endpoint = $"{API_VERSION}/stock/market/batch";  
            var request = new RestRequest(endpoint, Method.GET);  
            request.AddQueryParameter("symbols", string.Join(",", symbols));  
            request.AddQueryParameter("types", "chart");  
            request.AddQueryParameter("range", "3m");  
            request.AddQueryParameter("chartCloseOnly", "true");  
            request.AddQueryParameter("token", API_TOKEN);

            IRestResponse resp = client.Execute(request);  
            var stockHistory = JObject.Parse(resp.Content);

            var history = new List<ClosingStockHistory>();  
            foreach (var symbol in symbols)  
            {  
                var closingStockHistory = new ClosingStockHistory();  
                closingStockHistory.Symbol = symbol;  
                closingStockHistory.Prices = new List<ClosingPrice>();  
                var stock = stockHistory[symbol];  
                var chartData = (JArray)stock["chart"];  
                foreach (var itm in chartData)  
                {  
                    closingStockHistory.Prices.Add(new ClosingPrice() {  
                        Date = Convert.ToDateTime(itm["date"]),  
                        Price = Convert.ToDouble(itm["close"]) });  
                }  
                history.Add(closingStockHistory);  
            }

            return history;  
        }  
    }

    public class ClosingStockHistory  
    {  
        public string Symbol { get; set; }  
        public List<ClosingPrice> Prices { get; set; }  
    }

    public class ClosingPrice  
    {  
        public DateTime Date { get; set; }  
        public double Price { get; set; }  
    }  
}


Adding Stock Data to the Spreadsheet

Upon successful loading of the symbols spreadsheet into the Spread.NET component, we have all the information necessary to issue the call to the API and write the retrieved closing price history back into the same worksheet.

To begin this implementation, open MainPage.xaml.cs and add the following using statement:

				
					using GrapeCity.Windows.SpreadSheet.Data;


Add the following method to the MainPage class. The ProcessSpreadsheet method is responsible for reading the list of symbols from the uploaded document, issue the API calls and write the pricing history data back to the appropriate row in the current worksheet.

				
					private void ProcessSpreadsheet()  
{  
    List<string> stocks = new List<string>();  
    var worksheet = spreadControl.Sheets[0];  
    for (var i = 0; i < worksheet.RowCount; i++)  
    {  
        var stockSymbol = worksheet.Cells[i, 0].Text;  
        stocks.Add(stockSymbol);  
    }  
    StockHistoryRetriever retriever = new StockHistoryRetriever();  
    var data = retriever.Get3MonthHistory(stocks);  
    //calculate max columns required,  
    //increase the number of columns available in the worksheet  
    int maxCount = data.Max(x => x.Prices.Count());  
    worksheet.ColumnCount = maxCount + 1; //1 column for the symbol  
    //Similar to a CSS class, define header column style  
    var headerStyleName = "HeaderStyle";  
    var headerStyle = new StyleInfo()  
    {  
        Background = new SolidColorBrush(Colors.LightSeaGreen),  
        Name = headerStyleName,  
        BorderBottom = new BorderLine(Colors.SeaGreen),  
        BorderRight = new BorderLine(Colors.SeaGreen)  
    };  
    worksheet.NamedStyles.Add(headerStyle);  
    //set column header for the symbol assign header style  
    worksheet.ColumnHeader.Cells[0, 0].Text = "Symbol";  
    worksheet.ColumnHeader.Cells[0, 0].StyleName = headerStyleName;  
    bool setHeader = true;  
    foreach (var stock in data)  
    {  
        //find stock index  
        int rowIdx = 0;  
        int colIdx = 0;  
        spreadControl.Search(0, stock.Symbol, out rowIdx, out colIdx);  
        int columnCounter = 1;  
        foreach (var price in stock.Prices)  
        {  
            if (setHeader)  
            {  
                //set header text to date of the price,  
                //expand column width, set column header style  
                worksheet.ColumnHeader.Cells[0, columnCounter].Text =  
                    price.Date.ToString("MM/dd/yyyy");  
                worksheet.ColumnHeader.Cells[0, columnCounter].StyleName =  
                    headerStyleName;  
                worksheet.Columns[columnCounter].Width = 85;  
            }  
            //set cell to format to currency  
            worksheet.Cells[rowIdx, columnCounter].Formatter =  
                new GeneralFormatter(FormatMode.StandardNumericMode, "c");  
            worksheet.Cells[rowIdx, columnCounter].Value = price.Price;  
            columnCounter++;  
        }  
        setHeader = false;

        spreadControl.Invalidate();  
    }  
}


One of the main things to keep in mind is that we will be changing the dimensions of the spreadsheet. When it was first uploaded, the symbols sheet consisted of a single column with stock symbols defined one per row. Attempting to write to a column that didn’t previously exist will cause errors. Adjust the number of columns in a worksheet by setting the ColumnCount property to the total number of columns desired.

Immediately following the OpenExcel statement in the BtnLoadSpreadsheet_Click method, add a call to the new ProcessSpreadsheet function.
ProcessSpreadsheet();

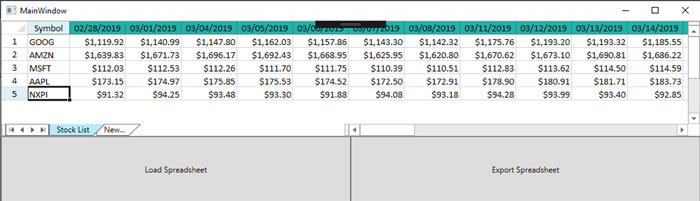
Rerun the application, and you will now see the three-month closing price history shown on the same row as the corresponding stock symbol. Export the spreadsheet to take this data offline.

Creating Sparkline Charts

Even though looking at all of this data collected is impressive, it would be better if paired with a visual. Sparkline graphs provide a compelling way to interpret this data at a glance. Spread.NET allows for the creation of a Sparkline graph through its powerful API. These Sparklines are fully customizable and can be built using the data already in the spreadsheet.

Alter the ProcessSpreadsheet with the following code:

				
					private void ProcessSpreadsheet()  
{  
    List<string> stocks = new List<string>();  
    var worksheet = spreadControl.Sheets[0];  
    for (var i = 0; i < worksheet.RowCount; i++)  
    {  
        var stockSymbol = worksheet.Cells[i, 0].Text;  
        stocks.Add(stockSymbol);  
    }  
    StockHistoryRetriever retriever = new StockHistoryRetriever();  
    var data = retriever.Get3MonthHistory(stocks);  
    //calculate max columns required,  
    //increase the number of columns available in the worksheet  
    int maxCount = data.Max(x => x.Prices.Count());  
    //1 column for the symbol, 1 column for the sparkline  
    worksheet.ColumnCount = maxCount + 2;  
    //set sparkline column width  
    worksheet.Columns[1].Width = 500;

    //define header column style  
    var headerStyleName = "HeaderStyle";  
    var headerStyle = new StyleInfo() {  
        Background = new SolidColorBrush(Colors.LightSeaGreen),  
        Name = headerStyleName,  
        BorderBottom = new BorderLine(Colors.SeaGreen),  
        BorderRight = new BorderLine(Colors.SeaGreen)};  
    worksheet.NamedStyles.Add(headerStyle);  
    //set column header for the symbol and sparkline column - assign header style  
    worksheet.ColumnHeader.Cells[0, 0].Text = "Symbol";  
    worksheet.ColumnHeader.Cells[0, 0].StyleName = headerStyleName;  
    worksheet.ColumnHeader.Cells[0, 1].Text = "Trend";  
    worksheet.ColumnHeader.Cells[0, 1].StyleName = headerStyleName;  
    bool setHeader = true;  
    foreach (var stock in data)  
    {  
        //find stock index  
        int rowIdx = 0;  
        int colIdx = 0;  
        spreadControl.Search(0, stock.Symbol, out rowIdx, out colIdx);  
        int columnCounter = 2;  
        foreach (var price in stock.Prices)  
        {  
            //set header to date, expand column width, set column header style  
            if (setHeader)  
            {  
                worksheet.ColumnHeader.Cells[0, columnCounter].Text =  
                    price.Date.ToString("MM/dd/yyyy");  
                worksheet.ColumnHeader.Cells[0, columnCounter].StyleName =  
                    headerStyleName;  
                worksheet.Columns[columnCounter].Width = 85;  
            }  

            //set cell to format to currency  
            worksheet.Cells[rowIdx, columnCounter].Formatter =  
                new GeneralFormatter(FormatMode.StandardNumericMode, "c");  
            worksheet.Cells[rowIdx, columnCounter].Value = price.Price;  
            columnCounter++;  
        }  
        setHeader = false;  

        //create sparkline  
        var range = new CellRange(rowIdx, 2, 1, stock.Prices.Count);  
        var settings = new SparklineSetting();  
        settings.AxisColor = SystemColors.ActiveBorderColor;  
        settings.LineWeight = 1;  
        settings.ShowMarkers = true;  
        settings.MarkersColor = Color.FromRgb(255, 0, 128);  
        settings.ShowFirst = true;  
        settings.ShowHigh = true;  
        settings.ShowLast = true;  
        settings.ShowNegative = true;  
        settings.FirstMarkerColor = Color.FromRgb(163, 73, 164);  
        settings.HighMarkerColor = Color.FromRgb(49, 78, 111);  
        settings.LastMarkerColor = Color.FromRgb(0, 255, 255);  
        settings.NegativeColor = Color.FromRgb(255, 255, 0);  
        //set row height  
        worksheet.Rows[rowIdx].Height = 250;  
        worksheet.SetSparkline(rowIdx, 1, range, DataOrientation.Horizontal,  
            SparklineType.Line, settings);  
        spreadControl.Invalidate();         
    }  
}


The ProcessSpreadsheet code now sets a row height and column width on the Sparkline column. Setting these values gives the Sparkline graph more room so that it is easier to read and interpret. You will also notice the code now Sparkline customization settings such as colors, as well as designate the cell range used to generate the graph in each row.

Excel Spreadsheet Components

This article only scratches the surface of the full capabilities of the Spread.NET spreadsheet component. Review the documentation to see some of the many available features. Integrating a spreadsheet component into your applications allows you to customize the experience of your users and provide them with familiar spreadsheet functionality without having to refer them to an external program.

In another article series, we demonstrate how to import and export Excel Spreadsheets in your WinForms app using C#, import/export Excel spreadsheets using JavaScript and how to import and export Excel spreadsheets in Angular.

This article appeared first on GrapeCity.

If you’re interested in developing expert technical content that performs, let’s have a conversation today.


Facebook
Twitter
LinkedIn
Reddit
Email

POST INFORMATION

If you work in a tech space and aren’t sure if we cover you, hit the button below to get in touch with us. Tell us a little about your content goals or your project, and we’ll reach back within 2 business days. 

Share via
Copy link
Powered by Social Snap