Search

Using GeoJSON Geometry Data to Draw Borders with TomTom Maps

Geographic Information System (GIS) data can come in a lot of forms, which can lead to confusion in how to represent data. For example, what would you call the borders of a certain county? Would you call it border, coordinates, or outline? Would you use longitude and latitude, or some other coordinate system, like distance from a given user? Mix that with the fact that there are multiple map APIs and other applications that will want to deal with geographical data, and you’re likely to end up with a lot of unnecessary format-parsing code.

Fortunately, to solve this problem, a standard has emerged. Specifically, the standard we will be talking about today is GeoJSON. GeoJSON is a standard that was initially created in 2008 by the Internet Engineering Task Force, which is a volunteer-staffed, non-profit, open standards operation, with the most recent version, RFC 7946, being made in 2016.

In this article we’ll look at the GeoJSON format, then use a GeoJSON data set to draw regional borders on a map with TomTom JavaScript Maps SDK for Web.

Project Setup

Today, we’ll be learning how to leverage GeoJSON to display new boundaries on a map. Specifically, we’ll be using theTomTom JavaScript Map SDK for Web to create a map and draw layers on it to highlight county regions, which are defined by a GeoJSON dataset.

To do this, we’ll need:

  • Some GeoJSON coordinates to draw on a map
  • TomTom API, to display the map
  • HTTP-Server, to host the web app

For the GeoJSON, we’ll just grab some coordinates from GitHub. This file on GitHub provides the raw GeoJSON data from Paul Bartsch’s ca_counties.geojson gist. These coordinates point to the counties of California. There’s also other data in the dataset to follow the GeoJSON standards, but all we need are the coordinates of the counties. Download and save the data as script.js. We will convert the GeoJSON to JavaScript we can use later.

To get started, you need the latest version of TomTom JavaScript Map SDK for Web. Extract the SDK to a folder called sdk in the same directory as where you’ll keep a simple index.html.

Once you have TomTom SDK, make sure you have a valid TomTom API Key, which requires you to register an account here.

Finally, you need an HTTP-Server to run your web app, which can be obtained via Node and NPM. (As of the time of writing, there is a bug with using the most recent version of HTTP-Server to host a web app, if you’re getting corrupt connection error, try running the following command to install an older version.)

				
					npm install -g http-server@0.9.0


Project Details

Now that we’ve got all the requirements set up, we can start building our app!

First, we need to create an index.html page. We need to import our TomTom SDK. To do that you need to import maps-web.min.js:

				
					<head>
	<meta http-equiv="X-UA-Compatible" content="IE=Edge" />
	<meta charset='UTF-8'>
	<title>TomTom Examples</title>
	<meta name='viewport'     content='width=device-width,initial-scale=1,maximum-scale=1,user-scalable=no'/>
	<link rel='stylesheet' type='text/css' href='sdk/maps.css' />
	<script src='sdk/maps-web.min.js'></script>
	<script src='script.js'></script>
</head>


Next, we need to create a DIV for our map. This is all we need for the body for the purposes of this article.

				
					<body>
  <div id='map' class='use-all-space' style="height: 300px; width: 300px"></div>
</body>


Now that we’ve made it through the HTML, we can get to the main meat of this article: implementing the map and drawing the layers, via JavaScript. The first thing to do in JavaScript is to import the GeoJSON data.

There are a few ways to do this:

  • you can download the file via an HTTP Request
  • you can just manually paste the GeoJSON in a script, which will be represented as a JavaScript object we would then store in a global variable that other scripts can access it.

In this tutorial, you’ll be assigning the GeoJSON directly in our JavaScript file. Specifically, in parameter “geoJson”, for simplicity’s sake.

Here’s what our map.js looks like:

				
					var geoJson = {
  "type": "FeatureCollection",
 
  "features": [
    { "type": "Feature", "properties": { "STATEFP": "06", "COUNTYFP": "107", "COUNTYNS": "00277318", "GEOID": "06107", "NAME": "Tulare", "NAMELSAD": "Tulare County", "LSAD": "06", "CLASSFP": "H1", "MTFCC": "G4020", "CSAFP": null, "CBSAFP": "47300", "METDIVFP": null, "FUNCSTAT": "A", "ALAND": -2147483648.000000, "AWATER": 37391604.000000, "INTPTLAT": "+36.2288317", "INTPTLON": "-118.7810618" }, "geometry": { "type": "Polygon", "coordinates": [ [ [ -119.475, 36.39 ], [ -119.475, 36.401 ], [ -119.529, 36.401 ], [ -119.527, 36.489 ], [ -119.573, 36.489 ], [ -119.466, 36.575 ], [ -119.305, 36.574 ], [ -119.305, 36.661 ], [ -118.985, 36.657 ], [ -118.982, 36.742 ], [ -118.351, 36.741 ], [ -118.335, 36.705 ], [ -118.366, 36.69 ], [ -118.331, 36.669 ], [ -118.338, 36.655 ], [ -118.321, 36.627 ], [ -118.275, 36.597 ], [ -118.292, 36.562 ], [ -118.239, 36.524 ], [ -118.235, 36.494 ], [ -118.25, 36.482 ], [ -118.216, 36.457 ], [ -118.21, 36.43 ], [ -118.157, 36.433 ], [ -118.139, 36.419 ], [ -118.163, 36.389 ], [ -118.1, 36.346 ], [ -118.128, 36.28 ], [ -118.106, 36.213 ], [ -118.059, 36.17 ], [ -118.074, 36.14 ], [ -118.067, 36.093 ], [ -118.052, 36.084 ], [ -118.034, 36.009 ], [ -118.004, 35.984 ], [ -118.017, 35.955 ], [ -117.983, 35.927 ], [ -117.981, 35.868 ], [ -118.007, 35.858 ], [ -118.008, 35.789 ], [ -119.538, 35.79 ], [ -119.529, 36.27 ], [ -119.475, 36.269 ], [ -119.475, 36.39 ] ] ] } }, { . . . } 
//The rest of the coordinates are omitted


GeoJSON is provided in the form of an object, which means we can set it to a variable and be able to access it anywhere in the JavaScript.

Another setup step is setting the product information. This can be done with tt.setProductInfo, which keeps track of the application’s name and version. TomTom’s new namespace is tt, be aware that this is a new change that came with TomTom JavaScript Map SDK Version 5.

With that out of the way, we can now implement TomTom’s map properly in JavaScript. The code is straightforward: tt.map expects an object to configure the map’s options.

Add this code below your body tag in index.html.

				
					<script>
  tt.setProductInfo('My First App', '1.0');
  var map = tt.map({
    container: 'map', // Id of the div to insert the map into
    key: '<API Key>',
    source: 'vector',
    basePath: '/sdk' // Location of the SDK folder
  });
</script>


Now for one last bit of setup, before we can start working with the GeoJSON: we need to create a map load function. This is important, otherwise, the code we’ll write will be executed before our map is. We’re going to just place it inside the script tag, below the setting up the map.

				
					<script>
  tt.setProductInfo('My First App', '1.0');
  var map = tt.map({
    container: 'map', // Id of the div to insert the map into
    key: '<API Key>',
    source: 'vector',
    basePath: '/sdk' // Location of the SDK folder
  });
  map.on('load',function(){

  }
</script>


Alright, it’s finally time to use that GeoJSON!

We’re going to use map.addLayer to draw on the map. The addLayer function expects an object, with specific inputs, as seen below.

				
					map.on('load',function(){
  map.addLayer({
    'id': geoJson["features"][0]["properties"]["NAME"],
    'type': 'fill',
    'source': {
      'type': 'geojson',
      'data': {
        'type': 'Feature',
        'geometry': geoJson["features"][0]["geometry"]
      }
    },
    'layout': {},
    'paint': {
      'fill-color': '#088',
      'fill-opacity': 0.8
    }
  })
}


The most important parts to note are the parts that aren’t hardcoded. IDs need to be unique. You can solve this by using the name of the county you’re in!

The Geometry parameter is a bit more complicated, but still straightforward. It contains some data about the coordinates, then it contains every coordinate needed for the county border. Our GeoJSON data is formatted perfectly for what the TomTom SDK requires, so we pass it in.

You can now launch the map by running http-server in your folder using Node and using any web browser to connect to one of the provided addresses.

Geo1

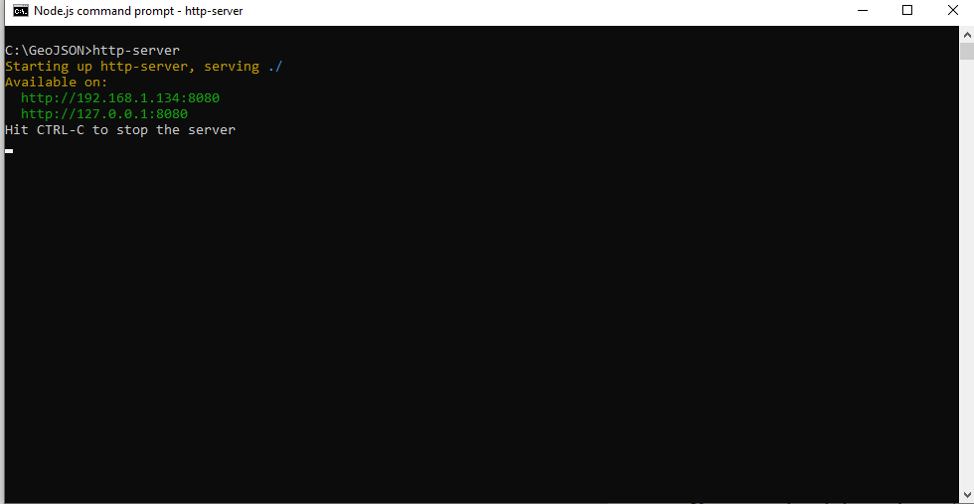
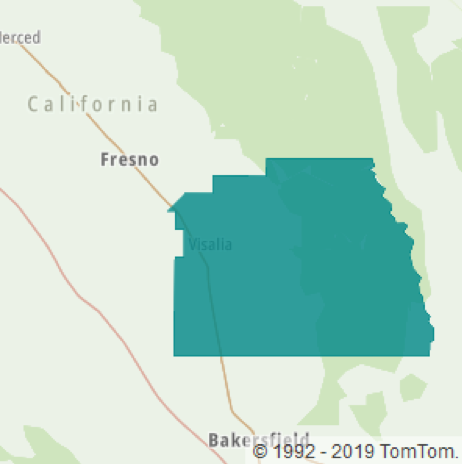
You should see something like this when you access either of the IP addresses with any browser:

geo2

That’s all well and good, but that’s only one object! What if we want more? There’s dozens in the provided GeoJSON file! Fortunately, there’s an easy way to do that. All you need to do is create a for-loop to iterate through the value of “features” from our GeoJSON!

Here’s the updated script.js:

				
					map.on('load',function(){
  for(var i=0;i<geoJson["features"].length;i++){
    //Limit it, because too many breaks the map.
    //Most of this code was copied from another provided tutorial.
    console.log(i);
    map.addLayer({
      'id': geoJson["features"][i]["properties"]["NAME"],
      'type': 'fill',
              'source': {
                'type': 'geojson',
                'data': {
                  'type': 'Feature',
                  'geometry': geoJson["features"][i]["geometry"]
                }
              },
      'layout': {},
      'paint': {
        'fill-color': '#088',
        'fill-opacity': 0.8
      }
    })
  }
});


If you’ve run it, you’ll probably find one slight problem. The entire map is missing, but if you try to look around the map, you can see your layers.

eo3

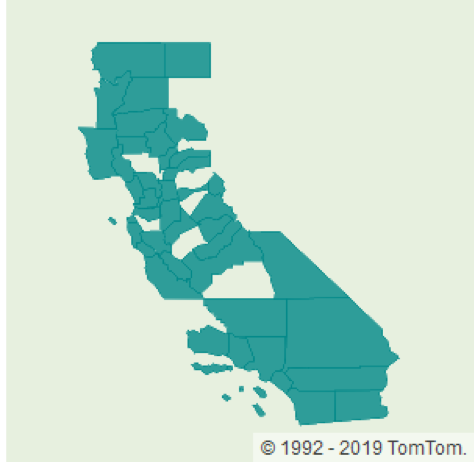
There’s an upper limit to how many coordinates you can have before the map doesn’t load properly. In this case, the total number of layers doesn’t seem that large. However, if you look back at the source data, you’ll notice that each county outline can contain dozens of coordinates. The more complicated outlines contain 90 or more coordinates each.

So, you want to be aware of the complexity of your underlying coordinate and layer data to make sure it renders correctly. You also want to keep this in mind to make sure users have a good experience in terms of being able to download your data set efficiently, even in low throughput mobile or wifi situations, and your data can be processed quickly, even on low-powered devices.

To address this situation for my sample, I simply decreased the number of layouts to draw.

				
					map.on('load',function(){
  for(var i=0;i<a["features"].length/4;i++){
    //Limit it, because too many breaks the map.
    //Most of this code was copied from another provided tutorial.
    console.log(i);
    map.addLayer({
      'id': geoJson["features"][i]["properties"]["NAME"],
      'type': 'fill',
      'source': {
        'type': 'geojson',
        'data': {
          'type': 'Feature',
          'geometry': geoJson["features"][i]["geometry"]
        }
      },
      'layout': {},
      'paint': {
      'fill-color': '#088',
      'fill-opacity': 0.8
      }
    })
  }
});


A more complete app might prioritize certain nearby counties, or smooth out boundary details not crucial to a zoomed-out view.

Next Steps

In this article, we went through implementing TomTom’s map, and drawing layers that were provided by a JSON object that was created in the GeoJSON standard.

You’ve set up everything needed to create the map, then you looped through our GeoJSON variable, and finally, you created layers to draw on top of a map.

Now that you know how to work with GeoJSON and TomTom’s Map API, you can start creating all sorts of apps! Maybe you want to highlight certain tourist attractions on a map, or mark certain countries that can match some trivia location, like “what states are the Appalachian mountains contained in?” The possibilities are endless!

If you’d like to learn more about GeoJSON, you can read more about it from the RFC document itself, or, if you’re interested in learning more or participate in GeoJSON’s development, you can check out their work group.

This article was originally posted on TomTom’s blog.

If you’re interested in developing expert technical content that performs, let’s have a conversation today.


Facebook
Twitter
LinkedIn
Reddit
Email

POST INFORMATION

If you work in a tech space and aren’t sure if we cover you, hit the button below to get in touch with us. Tell us a little about your content goals or your project, and we’ll reach back within 2 business days. 

Share via
Copy link
Powered by Social Snap