Elasticsearch started out as a wrapper for Apache Lucene, an open source search and index engine. Over time, it evolved into a full-featured, distributed document data store and now is the most popular enterprise search engine and database in the industry.
Elasticsearch adoption tends to fit several use cases. It can be used as a primary data store for application data, but since it doesn’t support transaction operations, it’s critical that you monitor its health and performance—if it goes down, any application depending on it will likely stop working.
As an aggregate datastore, Elasticsearch can provide real-time analytics of customer metrics, such as page views, website clicks and navigation, shopping cart use, and other digital events. Businesses rely on such analytics to make well-informed decisions that are essential for efficient application management. Monitoring Elasticsearch helps teams ensure the availability of such metric data.
Teams often use Elasticsearch as a repository to collect logs from multiple applications, as it provides views into logs from across your infrastructure—servers, containers, services, and so on—to help identify problems in real time. In this case, monitoring Elasticsearch ensures you’ll catch problems before you find out that you’re missing important log data.
Regardless of the use case, Elasticsearch deployments can be complicated. As a distributed system, Elasticsearch is made up of many elements, and when any of those reaches a faulty state, you must take appropriate action.
Elasticsearch installations can be as simple as a single index with a few shards on a single node, or far more complicated with many indices spread across thousands of shards running on hundreds of nodes. The more complex your deployment, the more critical monitoring is to ensure the health and performance of your cluster.
Key Elasticsearch metrics
Various elements in the Elasticsearch architecture produce metrics that you can monitor in real time. They tell different stories about different components, and not all metrics have the same importance, so let’s explore a few of the more critical Elasticsearch metrics you’ll want to keep a close eye on.
Tip: To view all available metrics, check out our Elasticsearch integration docs (which you’ll walk through setting up below).
Health and status metrics
cluster.status: Elasticsearch cluster health is indicated by color: red, yellow, or green. The cluster status color derives from the worst index status, which in turn derives from the worst shard status.
- Green means all primary shards and shard replicas are assigned to nodes.
- Yellow means the primary shard is assigned to nodes but replicas are not.
- Red indicates the shard is not allocated in the cluster.
Red status means some of the cluster data is unavailable, and it may take time until it’s completely recovered. If such a failure happens in an e-commerce application, for example, it will inevitably translate into lost sales.
cluster.nodes: Indicates the number of nodes in the cluster. An Elasticsearch cluster can be made up of one or more nodes hosted on a specific server. Having three master nodes ensures you’ll have a backup if one fails and helps you avoid a partitioned network, also known as a split-brain problem. Additional nodes can extend the cluster for horizontal scale.
shards.unassigned: In Elasticsearch, scalability and resilience are achieved when index information is horizontally partitioned in shards, which are distributed across various nodes. Primary shards are copied to replica shards to provide redundancy. If a node fails, other nodes within the cluster can serve data to maintain the availability of the information. A healthy cluster depends on every shard being assigned to a node.
However, if a primary shard can’t be assigned, the index will become unavailable, or no new documents will be written to the node. If replica shards can’t be allocated, the cluster could experience data loss. This is why monitoring unassigned shards is essential to maintaining healthy Elasticsearch clusters.
Performance metrics
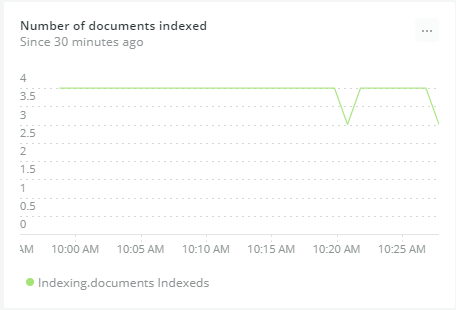
indexing.documentsIndexed: While running indexing benchmarks, you can calculate the indexing rate—how many documents are indexed per second. This metric is worth watching as sudden increases or declines in indexing rates could indicate issues with data sources.
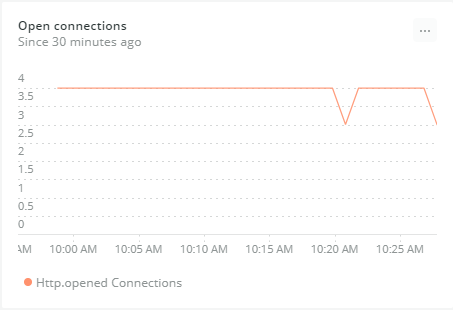
http.openedConnections: Shows the number of opened HTTP connections. If open connections are growing quickly over time, clients may be failing to keep persistent connections and constantly creating extra ones. Make sure your clients are configured to reuse open connections and avoid performance overhead.
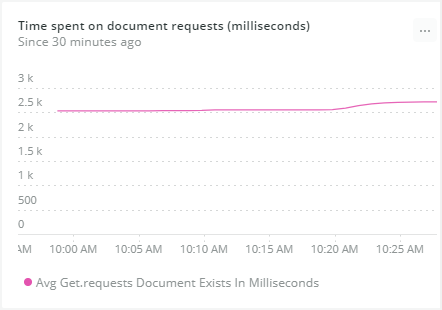
get.requestsDocumentExists: Indicates how well the cluster is performing. If queries are getting slower over time, your cluster may need more nodes.
Query response time is a crucial metric to observe in every system, and more so with a search engine like Elasticsearch. Poor search performance means painful user experiences in apps, plus this metric also may significantly affect analytical queries in background services.
Reasons for decreasing query performance include inefficient queries, cluster misconfiguration, JVM memory leaks, and damaged storage media.
Error metrics
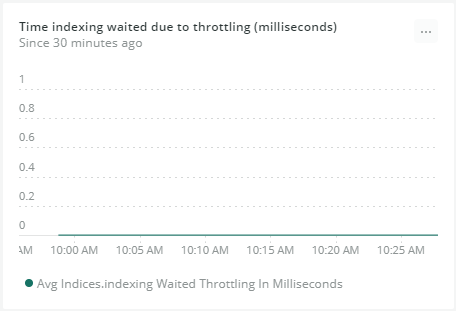
indices.indexingWaitedThrottlingInMilliseconds: You’ll want to watch for errors, such as excessive throttling. Your index can lose data if the application fails to retry throttled write requests. Worse, data can become out of date if writes are throttled but reads aren’t.
Retrying throttled requests also slows down processing.
Though it’s not a fatal error, excessive throttling might mean you’ve underestimated the write load and need to re-evaluate cluster size or architecture.
Monitoring Elasticsearch with New Relic
Our Elasticsearch integration uses the New Relic to collect and send performance metrics from your cluster to our platform.
The agent lives on the same machines as your Elasticsearch nodes. The agent collects and sends operational data from your Elasticsearch cluster to the New Relic platform, where you can monitor your Elasticsearch environment’s health. The New Relic agent collects metrics at the cluster, node, and index level to quickly uncover what may be causing problems.
Let’s look at the setup steps needed to monitor Elasticsearch on Linux (in this case, an Ubuntu server).
Note: You can also monitor Elasticsearch running as a service in Kubernetes or on Amazon ECS.
Install the agent and integration on an Ubuntu server
- From New Relic One, navigate to your account drop-down (in the top-right corner) and select Add more data.
- Select your operating system (in this case Ubuntu), and follow the prompts to get your license key and select your Ubuntu version.
- To deploy the infrastructure agent and the MySQL integration, run the following commands on your server:
- Import the infrastructure agent GPG Key.
curl -s https://download.newrelic.com/infrastructure_agent/gpg/newrelic-infra.gpg | sudo apt-key add -
- Add the New Relic repository (view all distributions here).
printf "deb [arch=amd64] https://download.newrelic.com/infrastructure_agent/linux/apt bionic main" | sudo tee -a /etc/apt/sources.list.d/newrelic-infra.list
- Install the infrastructure agent (newrelic-infra) and Redis integration (nr-redis).
sudo apt-get update && sudo apt-get install -y newrelic-infra nri-elasticsearch
- Import the infrastructure agent GPG Key.
Configure the Elasticsearch integration
To configure the on-host integration, edit the integration’s YAML config file, elasticsearch-config.yml to place required login credentials and configure how data is collected. The Elasticsearch integration documentation provides a list of configuration options, or you can use this example config file.
View Elasticsearch data in New Relic
To start monitoring your nodes and clusters, navigate to Infrastructure > Third-party Services > Elasticsearch Dashboard.
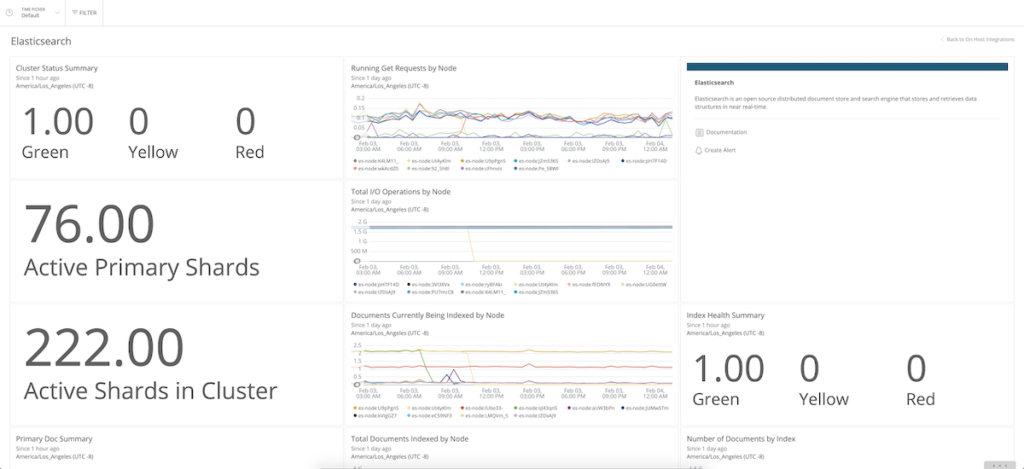
Let’s look at some examples of Elasticsearch monitoring data in New Relic, with a focus on some of the key metrics mentioned earlier. Let’s start with health and status metrics.
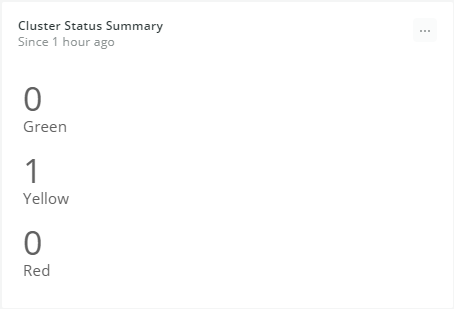
The Cluster Status Summary panel indicates that one cluster (green) has all of its primary shards and shard replicas assigned to nodes, while another cluster (yellow) has its primary shards assigned to nodes, but its replicas are not assigned.
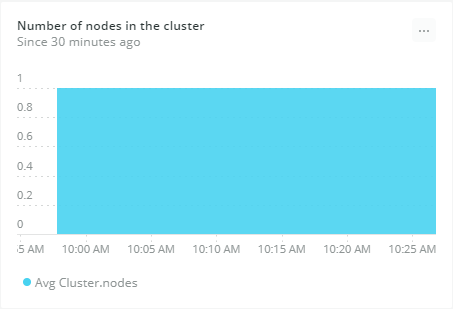
The next chart shows how many nodes are in the cluster. You can monitor it to find out if that number is lower than the number you configured.
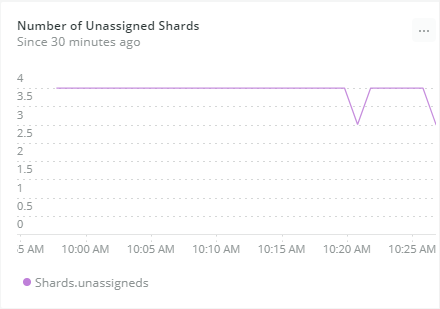
The number of unassigned shards directly affects cluster health. You’ll want to fix any problems so all shards are allocated to nodes.
New Relic also makes it easy to monitor performance metrics for Elasticsearch. For example, monitoring sudden, unexpected increases or decreases in the number of indexed documents may help identify abnormal application activity.
The Number of open connections chart gives an idea of how heavily applications are using the Elasticsearch cluster.
Time spent on get requests illustrates requests for documents. Higher numbers mean slower queries, which might indicate your cluster needs more nodes.
The Time indexing waited due to throttling metric helps you keep an eye on excessive throttling, which is a sign of errors.
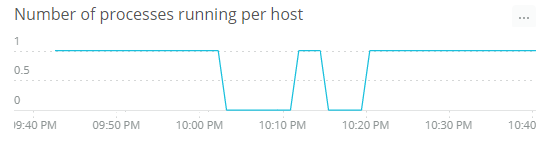
Unlike the previous items, downtime is not a metric, but an alert condition you should create. Downtime is a serious event because it means your clients aren’t being served data from Elasticsearch. Whenever downtime occurs, you need to be notified right away.
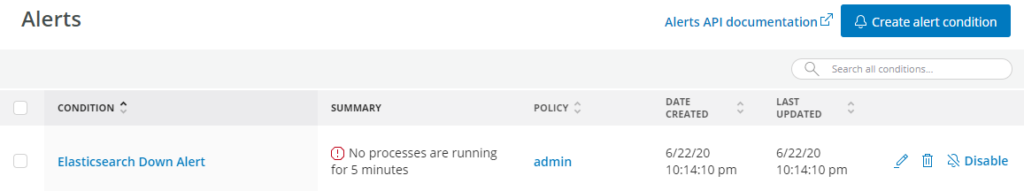
You can configure the downtime alert to trigger when the number of Elasticsearch processes running on the host machine drops to zero, and you can define the admin users who will receive email alerts.
Ready to monitor Elasticsearch?
You’ve now seen why monitoring is essential for achieving a reliable, scalable, and resilient Elasticsearch cluster, and the key metrics you should monitor to make sure your clusters are operating reliably, scaled appropriately, and staying resilient.
New Relic’s integration is an invaluable way to help keep Elasticsearch systems healthy. And although there are plenty of elements in Elasticsearch that can be monitored, some are more critical, and it’s a good idea to know which key metrics are especially worth watching. By providing developers with early alerts on critical metrics, New Relic helps them prevent failures that might result in slow responses, unexpected downtime, and data loss.
The Elasticsearch integration is open source software. That means you can browse its source code and send improvements, or create your own fork and build it.
Check out our full list of on-host integrations for more.
This article was originally published on NewRelic’s blog.
If you’re interested in developing expert technical content that performs, let’s have a conversation today.