Redis is a lightning-fast, distributed, in-memory key-value database. While Redis usually isn’t used as a primary data store, it’s often used as a fast cache in areas of applications where performance is paramount. As an in-memory key-value database, Redis is much faster than traditional database systems. It’s also commonly used as a lightweight distributed queue. You can use Redis’s distributed pub/sub feature to dispatch messages to various recipients without building the functionality yourself.
Such use cases make Redis an integral part of any app it’s built into, so it’s important to ensure it has peak performance. Otherwise, your app performance will degrade, resulting in a poor user experience at best. At worst, your application will fail to work at all.
Redis deployments can also be complicated, ranging from a single in-memory node to a multi-node cluster, or even hybrid in-memory/on-disk deployments via Redis on Flash. The more nodes in your Redis cluster, the more potential points of failure.
Consequently, monitoring Redis is critical. And because Redis is used in so many different scenarios, making sure you’re monitoring the right metrics for your use case is important. Ensuring Redis stays healthy helps create a top-notch user experience and alleviates the burden on transactional databases.
Key Redis metrics
Since Redis-based application architectures can become quite complex, the components and data interactions involved produce many different metrics that you should monitor in real time. Not all metrics have the same weight, so let’s examine some of the critical Redis metrics worth watching.
Tip: To view all available metrics, check out our Redis integration docs (which we’ll walk through setting up below).
Status metrics
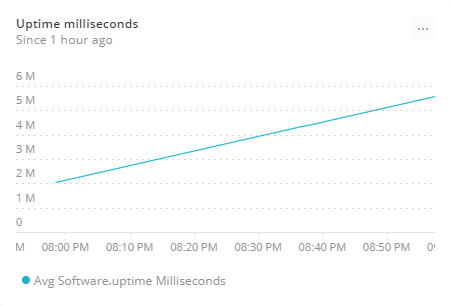
software.uptimeMilliseconds: Number of milliseconds since the Redis server starts. An unexpectedly low value here might mean Redis has recently crashed. You want to make sure the service is not restarting, so the higher uptime, the better.
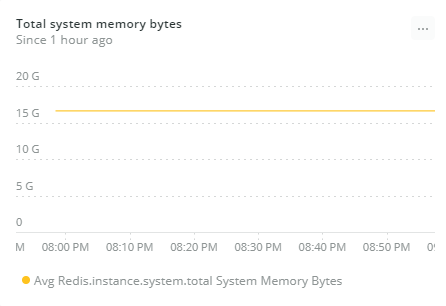
system.totalSystemMemoryBytes: This is the amount of memory in bytes available in the instance where Redis is running. Monitoring this metric is important. If your Redis installation is not capable of scaling out and the host machine runs out of memory, the operating system may kill the Redis server process. You can improve the number by adding storage capacity to meet increased demands.
Performance metrics
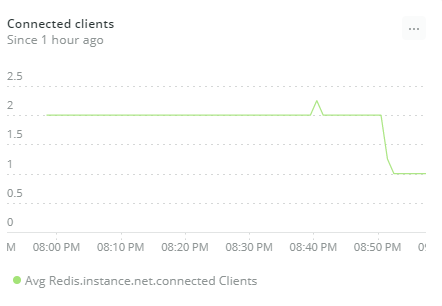
net.connectedClients: This is the number of client connections (excluding connections from replicas). Since Redis is single-threaded, one process serves all client requests. If the number of connected clients grows, the server will spend less resource time processing each request, so clients will need to wait longer for responses. Monitoring the number of clients may also reveal applications that are creating unexpected client connections or failing to close them after use.
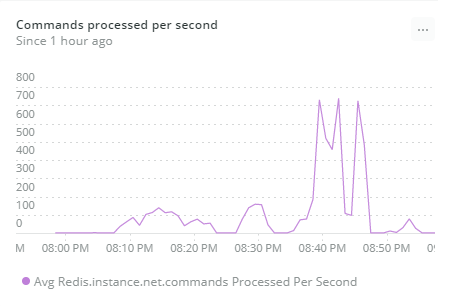
net.commandsProcessedPerSecond: Monitoring this metric is critical to ensure Redis is performing to a high standard. If you notice both a high latency connection and low throughput, you can investigate the causes of these problems, then identify and remove the root issues.
- If the number is constant, the cause is not a computationally intensive command.
- If the number drops abruptly, there are slow commands causing latency issues.
- An unusual decline in the numbers may indicate either low command volume or slow commands.
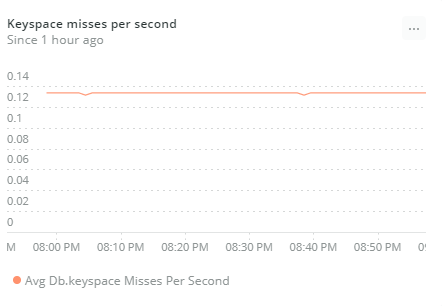
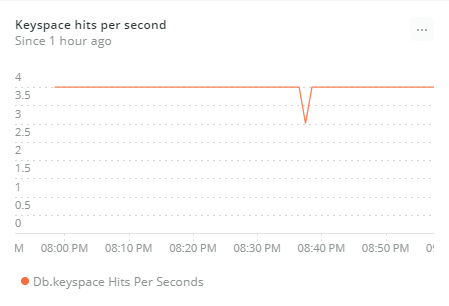
db.keyspaceHitsPerSecond and db.keyspaceMissesPerSecond: This is the number of successful lookups of keys in the main dictionary and the number of failed lookups in the main dictionary per second.
When combined in a new metric called cache hit ratio, these two metrics can indicate whether the Redis cache is being used effectively. The cache hit ratio is the number of keyspace hits divided by the sum of keyspace hits and keyspace misses. In other words, the percentage of successful reads per second, among all read operations in the Redis database per second.
A low cache hit ratio could be caused by several factors, including expired data and insufficient memory allocation to Redis. Low hit ratios mean high app latency because apps will have to fetch data from slower databases.
Error metrics
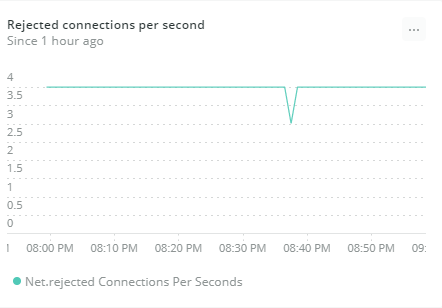
net.rejectedConnectionsPerSecond: The number of connections rejected per second due to the client limit. You should continually watch this critical metric because an increase in the number of rejected connections might indicate one of the following scenarios:
- Unauthorized clients are requesting new connections. In that case, you should identify the applications requiring these connections and revise their processes.
- Legitimate but unforeseen clients are trying to establish connections, but the
maxclientsvalue was underestimated. Redis allows you to fix the issue by increasing themaxclientsconfiguration.
Maintaining an appropriate total number of connections will help you optimize Redis performance.
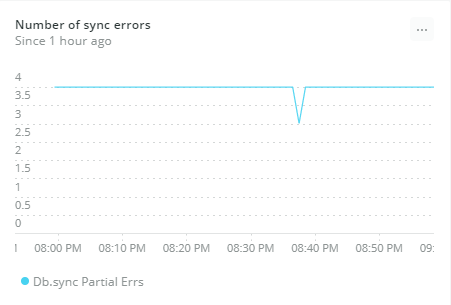
db.syncPartialErr: This is the number of times partial syncs failed to complete. Replication between master and replicas occurs based on a specific replication ID defined by the master. When a replica is elected as the new master, that replication ID also changes. In this case, partial resynchronization between replicas and the old master will still be possible.
Monitoring Redis with New Relic
Our Redis integration uses the New Relic Infrastructure agent to collect and send performance metrics from your Redis instance to our platform.
The New Relic infrastructure agent lives on the same machines as your Redis nodes, collects critical performance data from your Redis server, and sends it to the New Relic platform. You can monitor the environment with pre-built dashboards, create alert policies, custom queries, and custom charts.
Let’s look at the setup steps needed to monitor Redis on Linux, in this case, an Ubuntu server.
Note: You can also monitor Redis running as a service in Kubernetes or on Amazon ECS.
Install the agent and integration on an Ubuntu server
- From New Relic One, navigate to your account drop-down (in the top-right corner) and select Add more data.
- Select your operating system (in this case Ubuntu), and follow the prompts to get your license key and select your Ubuntu version.
- To deploy the Infrastructure agent and the Redis integration, run the following commands on your server:
- Import Infrastructure agent GPG Key
curl -s https://download.newrelic.com/infrastructure_agent/gpg/newrelic-infra.gpg | sudo apt-key add -
- Add the New Relic repository (view all distributions here)
printf "deb [arch=amd64] https://download.newrelic.com/infrastructure_agent/linux/apt bionic main" | sudo tee -a /etc/apt/sources.list.d/newrelic-infra.list
- Install the infrastructure agent (
newrelic-infra) and Redis integration (nri-redis)sudo apt-get update && sudo apt-get install -y newrelic-infra nri-redis
- Import Infrastructure agent GPG Key
Configure the Redis integration
- Change the directory to the integrations configuration folder:
cd /etc/newrelic-infra/integrations.d
- Copy the sample configuration file:
sudo cp redis-config.yml.sample redis-config.yml
- Edit the
redis-config.ymlfile based on your Redis server connection methods:- Connect with Unix socket: If you connect using Unix socket, specify the
unix_socket_pathin the configuration file. If more than one Redis instances are using Unix sockets, make sure to setuse_unix_socketto true. Be sure that the user executing the Redis integration has correct permissions for accessing that Unix socket. The permissions of the Unix socket are set in the Redis configuration (value ofunixsocketperm). - Connect with TCP: If you connect via TCP, the config file is by default set to
localhostand port6379. You can change this by specifyinghostnameor theportargument. If you use this method, theunix_socket_pathparameter cannot be set.
- Connect with Unix socket: If you connect using Unix socket, specify the
- If required, set other configuration file settings based on your Redis setup, as described in the configuration portion of the Redis integration docs.
- Restart the infrastructure agent:
systemctl restart newrelic-infra
View Redis data in New Relic
To start monitoring your Redis databases, navigate to Infrastructure > Third-party Services > Redis Dashboard.
Let’s look at some examples, focusing on some of the key metrics mentioned earlier. We’ll start with status metrics.
The Uptime milliseconds chart tracks Redis availability. The higher uptime, the better, because it means the server has been available for longer, nonstop.
Use the Total system memory bytes to predict when you should add storage capacity to meet increasing demands.
The Connected clients chart gives you an opportunity to examine whether your Redis deployment is accommodating your client processes and apps.
Keep an eye on the Commands processed per second chart to see any sudden decreases, which may indicate slow commands and latency issues.
The Keyspace hits per second and Keyspace misses per second charts display the cache hit ratio, or how efficiently your clients are using Redis.
The Rejected connections per second chart allows you to visualize any spikes in the number, which may indicate unauthorized clients are requesting new connections, or that you underestimated your maxclients configuration.
With the Number of sync errors chart, you can easily catch any unexpected increases, which may indicate master instances are failing frequently.
Wrapping Up
You’ve now seen why monitoring is essential for achieving a fast, scalable, and fault-tolerant Redis database, and learned about the key metrics you should monitor to make sure your Redis master and replica instances are operating at their best.
New Relic’s integration is a valuable tool you can use to help keep Redis instances healthy. By providing early warnings on critical metrics, New Relic helps prevent database failures that might result in a poor user experience in apps, a higher burden on transactional databases, and rejected client connections.
The Redis integration is open source software. That means you can browse its source code and send improvements, or create your own fork and build it.
Check out our full list of on-host integrations for more.
This article was originally published on New Relic’s blog
If you’re interested in developing expert technical content that performs, let’s have a conversation today.